 Flat by Close
Performance
Every trade since the strategy started running in real time on Aug 25, 2026, at one ES and one NQ contract per signal. The strategy runs on a simulation account, so every figure on this page is a simulated result. Nothing has been removed for being a losing trade or a losing day.
Real-time simulated record · Aug 25 – Oct 23, 2026
All trades are executed in a simulation account, not a live market.
These results are based on simulated or hypothetical performance results that have certain inherent limitations. Unlike the results shown in an actual performance record, these results do not represent actual trading. Also, because these trades have not actually been executed, these results may have under- or over-compensated for the impact, if any, of certain market factors, such as lack of liquidity. Simulated or hypothetical trading programs in general are also subject to the fact that they are designed with the benefit of hindsight. No representation is being made that any account will or is likely to achieve profits or losses similar to these being shown.
Winning trades are more frequent but smaller than losing trades: the strategy typically risks more than it aims to make on each trade and relies on a high win rate. 38 trading sessions, 22 green and 16 red. Days the strategy stands aside for CPI, FOMC decisions and payrolls are not counted as sessions.
Cumulative net, by session ($, 1 ES + 1 NQ)
Drawdown from the running high ($)
Deepest drawdown −$5,752.50, reached on Aug 31, 2026.
The whole journey, by how it was produced · Apr 1 – Oct 23, 2026
Before running in real time, the strategy went through a rebuilt history, a forward-simulated stretch and platform replays. Each period is labelled by how its numbers were produced, and the rules changed between periods. All of it is simulated or hypothetical.
All trades are executed in a simulation account, not a live market.
These results are based on simulated or hypothetical performance results that have certain inherent limitations. Unlike the results shown in an actual performance record, these results do not represent actual trading. Also, because these trades have not actually been executed, these results may have under- or over-compensated for the impact, if any, of certain market factors, such as lack of liquidity. Simulated or hypothetical trading programs in general are also subject to the fact that they are designed with the benefit of hindsight. No representation is being made that any account will or is likely to achieve profits or losses similar to these being shown.
| Period | How it was produced | Sessions | Net | ES / NQ | Green / red days | Best / worst day | Max drawdown |
|---|---|---|---|---|---|---|---|
| Apr 1 – Jun 8 | Rebuilt — hypothetical. Recomputed from the historical signal list under an earlier, simpler rule set. | 46 | +$13,890 | −1,075 / +14,965 | 27 / 18 | +2,600 / −2,400 | −$4,815 |
| Jun 10 – Jul 22 | Forward-simulated — hypothetical. Computed in real time from live market data; no orders placed. Same rules as above. | 29 | +$955 | −850 / +1,805 | 15 / 14 | +3,000 / −5,250 | −$7,650 |
| Jul 23 – Aug 21 | Replay — hypothetical. Earlier builds replayed on the trading platform (two days run in real time). Aug 3–7 entered as one weekly NQ total. | 16 + 1 wk | +$6,160 | −3,900 / +10,060 | 8 / 8 | +3,288 / −1,755 | −$3,975 |
| Aug 25 – Oct 7 | Real-time simulated, first build. Real-time orders on a simulation account. 95 trades, 67.4% won, profit factor 1.11. | 27 | +$3,497.50 | +$6,062.50 / −$2,565 | 14 / 13 | +$2,500 / −$3,740 | −$5,752.50 |
| Oct 8 – Oct 23 | Real-time simulated, current build. Refinements to position management and the end-of-day close. 38 trades, 78.9% won, profit factor 1.83. Short sample. | 11 | +$6,692.50 | +$887.50 / +$5,805 | 8 / 3 | +$2,100 / −$1,250 | −$1,485 |
| Real-time simulated total | Aug 25 – Oct 23, 2026 · 133 trades · 70.7% won · profit factor 1.25 | 38 | +$10,190 | +$6,950 / +$3,240 | 22 / 16 | +$2,500 / −$3,740 | −$5,752.50 |
| All periods | Apr 1 – Oct 23 · mixed basis, most of it hypothetical | — | +$31,195 | — | — | — | −$7,650 |
| Month (2026) | ES | NQ | Total | Basis |
|---|---|---|---|---|
| April | −$650 | +$5,500 | +$4,850 | Rebuilt (hypothetical) |
| May | −$1,437.50 | +$4,465 | +$3,027.50 | Rebuilt (hypothetical) |
| June | −$3,275 | +$7,740 | +$4,465 | Rebuilt to Jun 8, forward-simulated from Jun 10 (hypothetical) |
| July | −$462.50 | +$4,065 | +$3,602.50 | Forward-simulated to Jul 22, replay from Jul 23 (hypothetical) |
| August | −$875 | +$1,570 | +$695 | Replay to Aug 21 (hypothetical) · real-time simulated from Aug 25 (−$4,365) |
| September | +$5,287.50 | +$3,160 | +$8,447.50 | Real-time simulated |
| October (to Oct 23) | +$2,537.50 | +$3,570 | +$6,107.50 | Real-time simulated · current build from Oct 8 |
| Total | +$1,125 | +$30,070 | +$31,195 | Mixed basis · real-time simulated part +$10,190 |
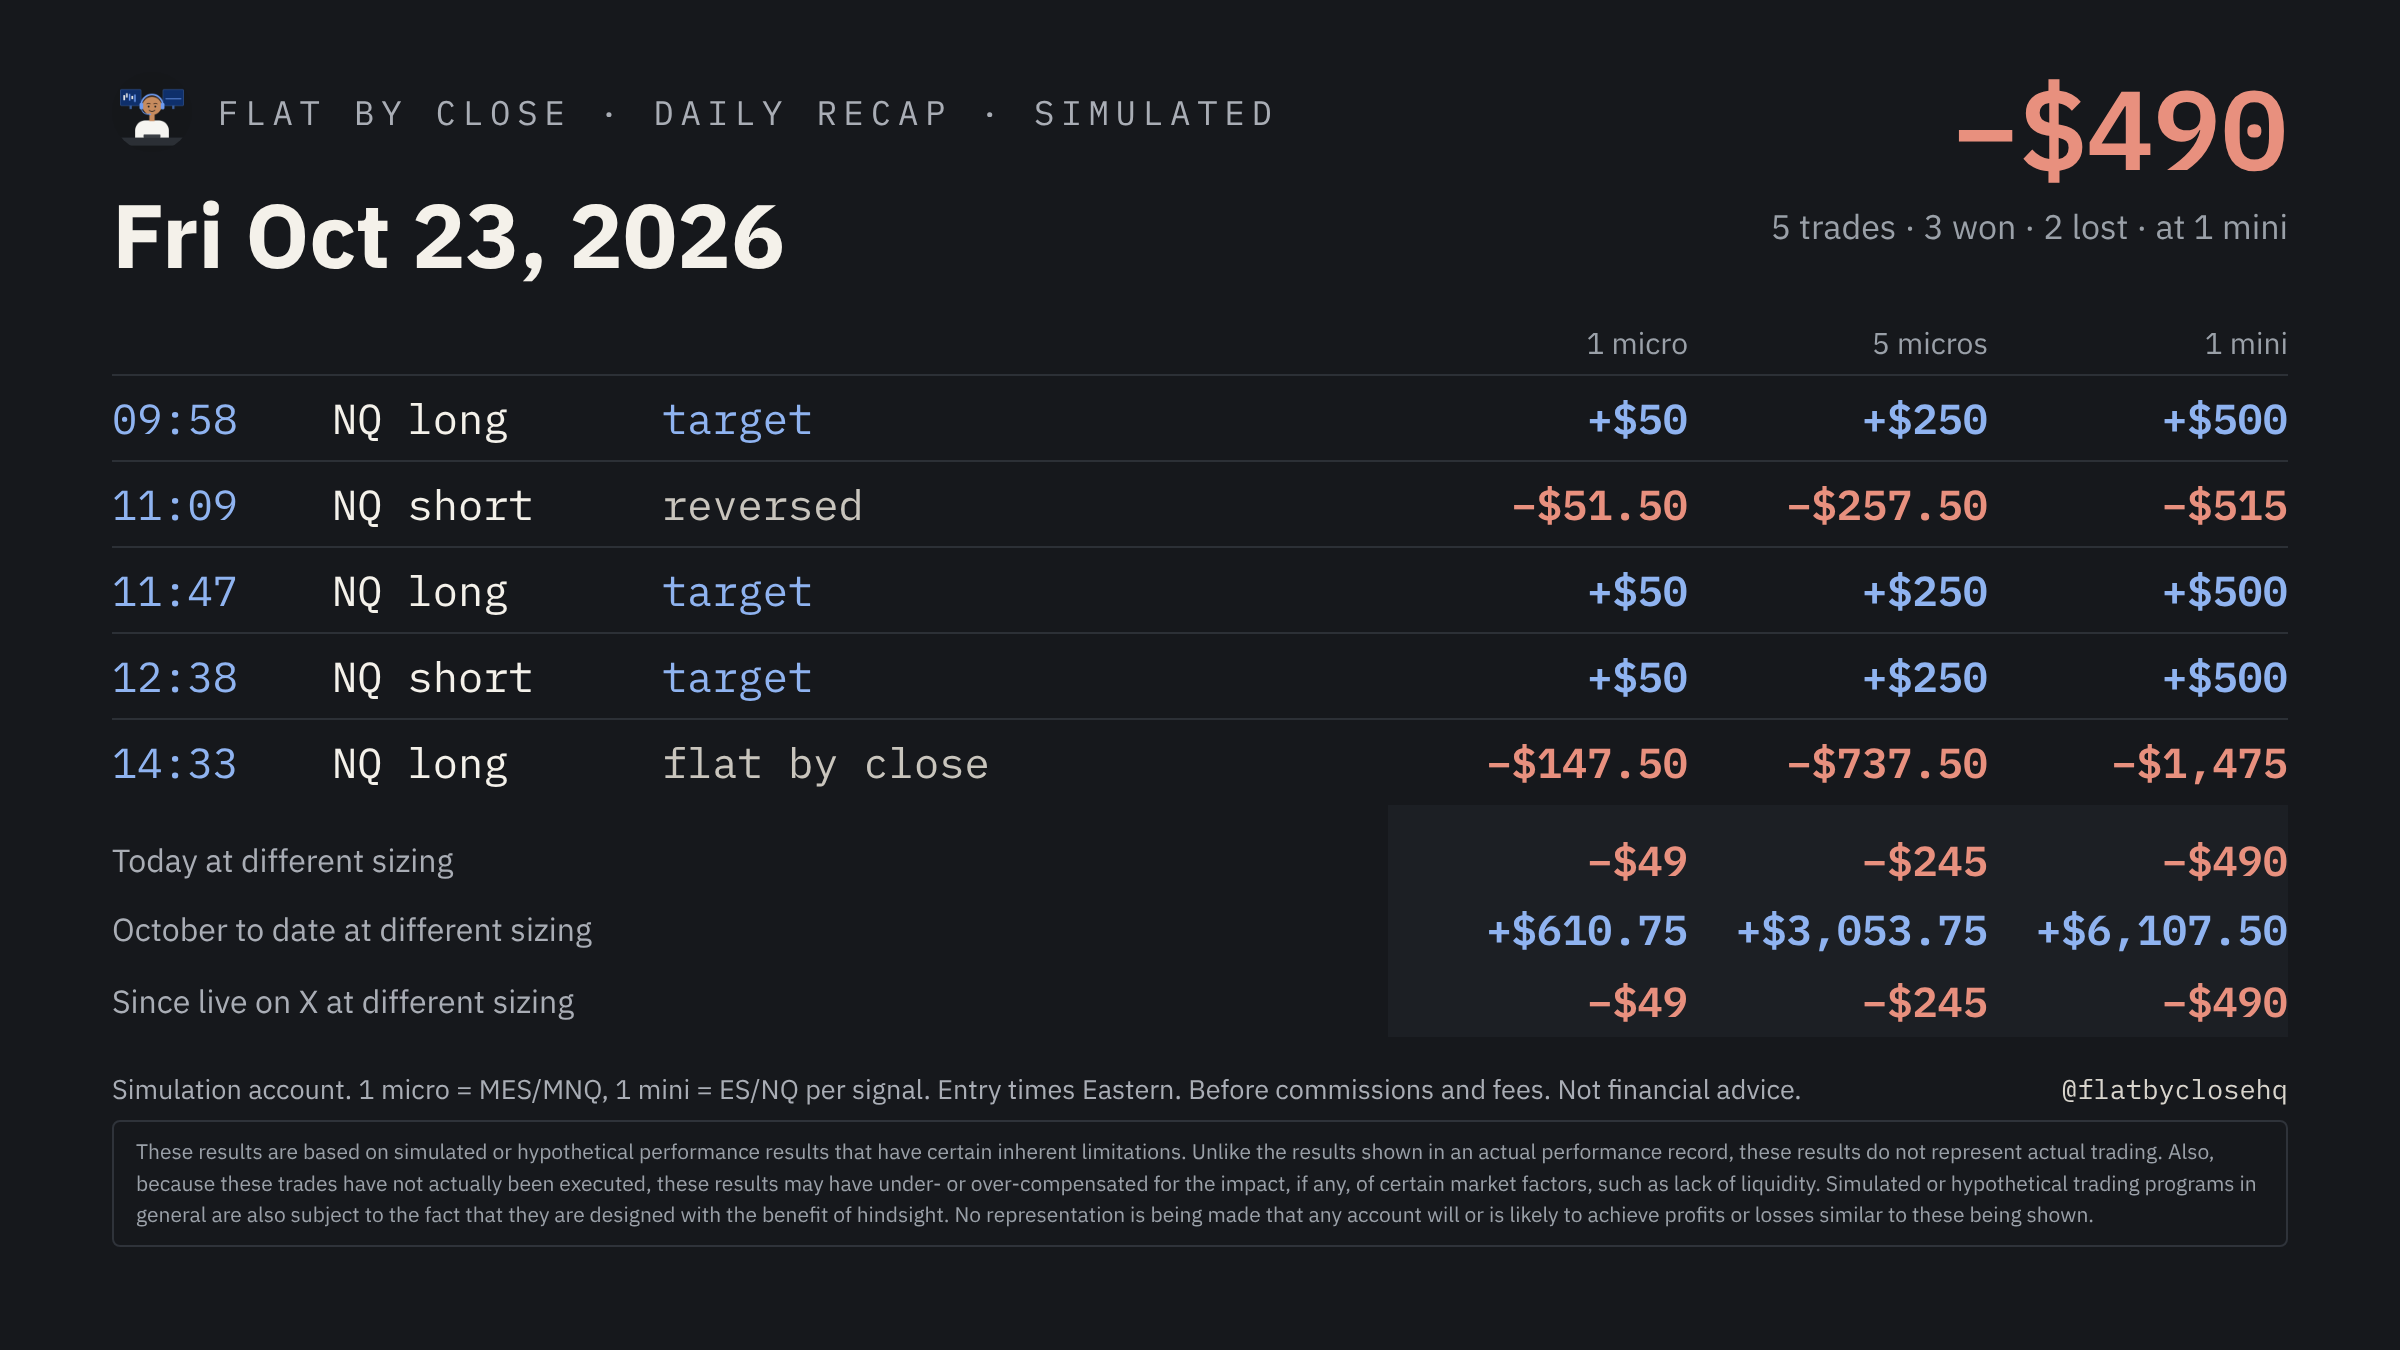
Since posting every trade live on X (Oct 23, 2026): 5 trades, −$490.
Latest daily recap
The card posted on X after the close on Oct 23, 2026. Each trade at 1 micro, 5 micros and 1 mini.
How to read these numbers
- One ES and one NQ contract per signal. When the strategy adds a second unit, that is included at its real size. Micro contracts (MES, MNQ) are one-tenth of these figures.
- Before commissions, exchange fees, data costs and slippage, all of which reduce real results. Copier software adds its own delay.
- The rules were refined between periods, and the real-time builds also stand aside on CPI, FOMC and payroll days. Results from different periods are not directly comparable.
- Before Aug 25, 2026 the record was rebuilt, forward-simulated or replayed rather than run in real time. It is shown to tell the whole story, not as a track record.
- Gaps: Aug 22 and Aug 24 are not in any record, and Aug 3–7 survives only as a weekly NQ total. Nothing has been removed for being a losing day.
- The full trade log is available for verification on request.
All trades are executed in a simulation account, not a live market.
These results are based on simulated or hypothetical performance results that have certain inherent limitations. Unlike the results shown in an actual performance record, these results do not represent actual trading. Also, because these trades have not actually been executed, these results may have under- or over-compensated for the impact, if any, of certain market factors, such as lack of liquidity. Simulated or hypothetical trading programs in general are also subject to the fact that they are designed with the benefit of hindsight. No representation is being made that any account will or is likely to achieve profits or losses similar to these being shown.